Priorización territorial para la construcción de Condominios de Viviendas Tuteladas para Personas Mayores
Motivation
The development of Condominios de Viviendas Tuteladas (CVT) requires identifying territories where different demographic, social, territorial and institutional conditions create greater priority for intervention.
Territorial priority cannot be explained by a single indicator. Population characteristics, social vulnerability, housing conditions, territorial quality, institutional capacity and environmental risks vary considerably between communes.
The Índice de Priorización Territorial para la Construcción de Condominios de Viviendas Tuteladas (IPT-CVT) integrates these different dimensions into a single territorial prioritization framework.
The objective is to provide a quantitative framework to support territorial decision-making and the identification of communes where the construction of CVT may have greater relative priority.

Data
The analysis covers 52 communes of the Metropolitan Region of Chile.
The IPT-CVT integrates 22 territorial indicators covering demographic, social, territorial, institutional and environmental conditions.
The data come from different administrative and territorial sources, including:
CASEN · RSH / ADIS · INE · SENAMA · SII · Municipal and Territorial Data
The resulting analytical matrix contains one row for each commune and one column for each territorial indicator.
Territorial data matrix
Method
The IPT-CVT was constructed as a composite territorial index.
The methodological process consists of several stages.
1. Indicator construction
Territorial indicators were constructed from demographic, social, institutional, environmental and territorial information.
2. Normalization
Indicators measured on different scales and units were transformed to a common scale to make them comparable.
3. Direction
Indicators were oriented so that their values consistently represented their contribution to territorial priority.
4. Weighting
Weights were assigned to indicators and dimensions according to the methodological framework of the index.
5. Aggregation
The normalized and weighted indicators were aggregated to produce a composite territorial prioritization score for each commune.
The resulting index allows communes to be compared according to their relative territorial priority for the construction of Condominios de Viviendas Tuteladas.
Resultados
Análisis descriptivo
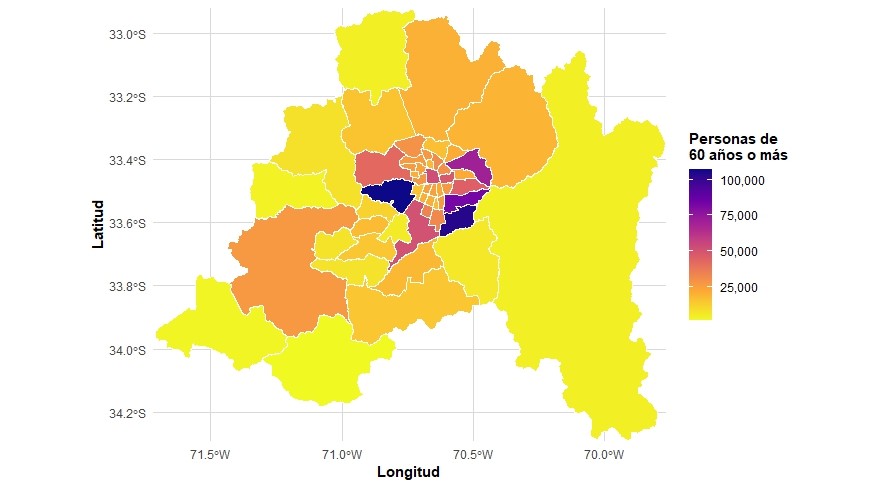
Antes de presentar los resultados de la priorización territorial, se examina la distribución espacial de la población de 60 años o más entre las comunas de la Región Metropolitana de Santiago.
Distribución de la población de 60 años o más
El mapa muestra la distribución de las personas de 60 años o más en las 52 comunas de la Región Metropolitana. La intensidad del color representa el número de personas de 60 años o más residentes en cada comuna, permitiendo observar diferencias en su concentración territorial.
Proporción de personas mayores sin redes de apoyo
La distribución territorial de las personas mayores sin redes de apoyo constituye un antecedente relevante para caracterizar las condiciones sociales asociadas a la necesidad potencial de apoyo y cuidados.
El siguiente mapa interactivo permite explorar la distribución de este indicador entre las 52 comunas de la Región Metropolitana. La intensidad del color representa la proporción de personas mayores sin redes de apoyo en cada comuna. Al seleccionar una comuna es posible consultar su valor específico.
Distribution of normalized indicators
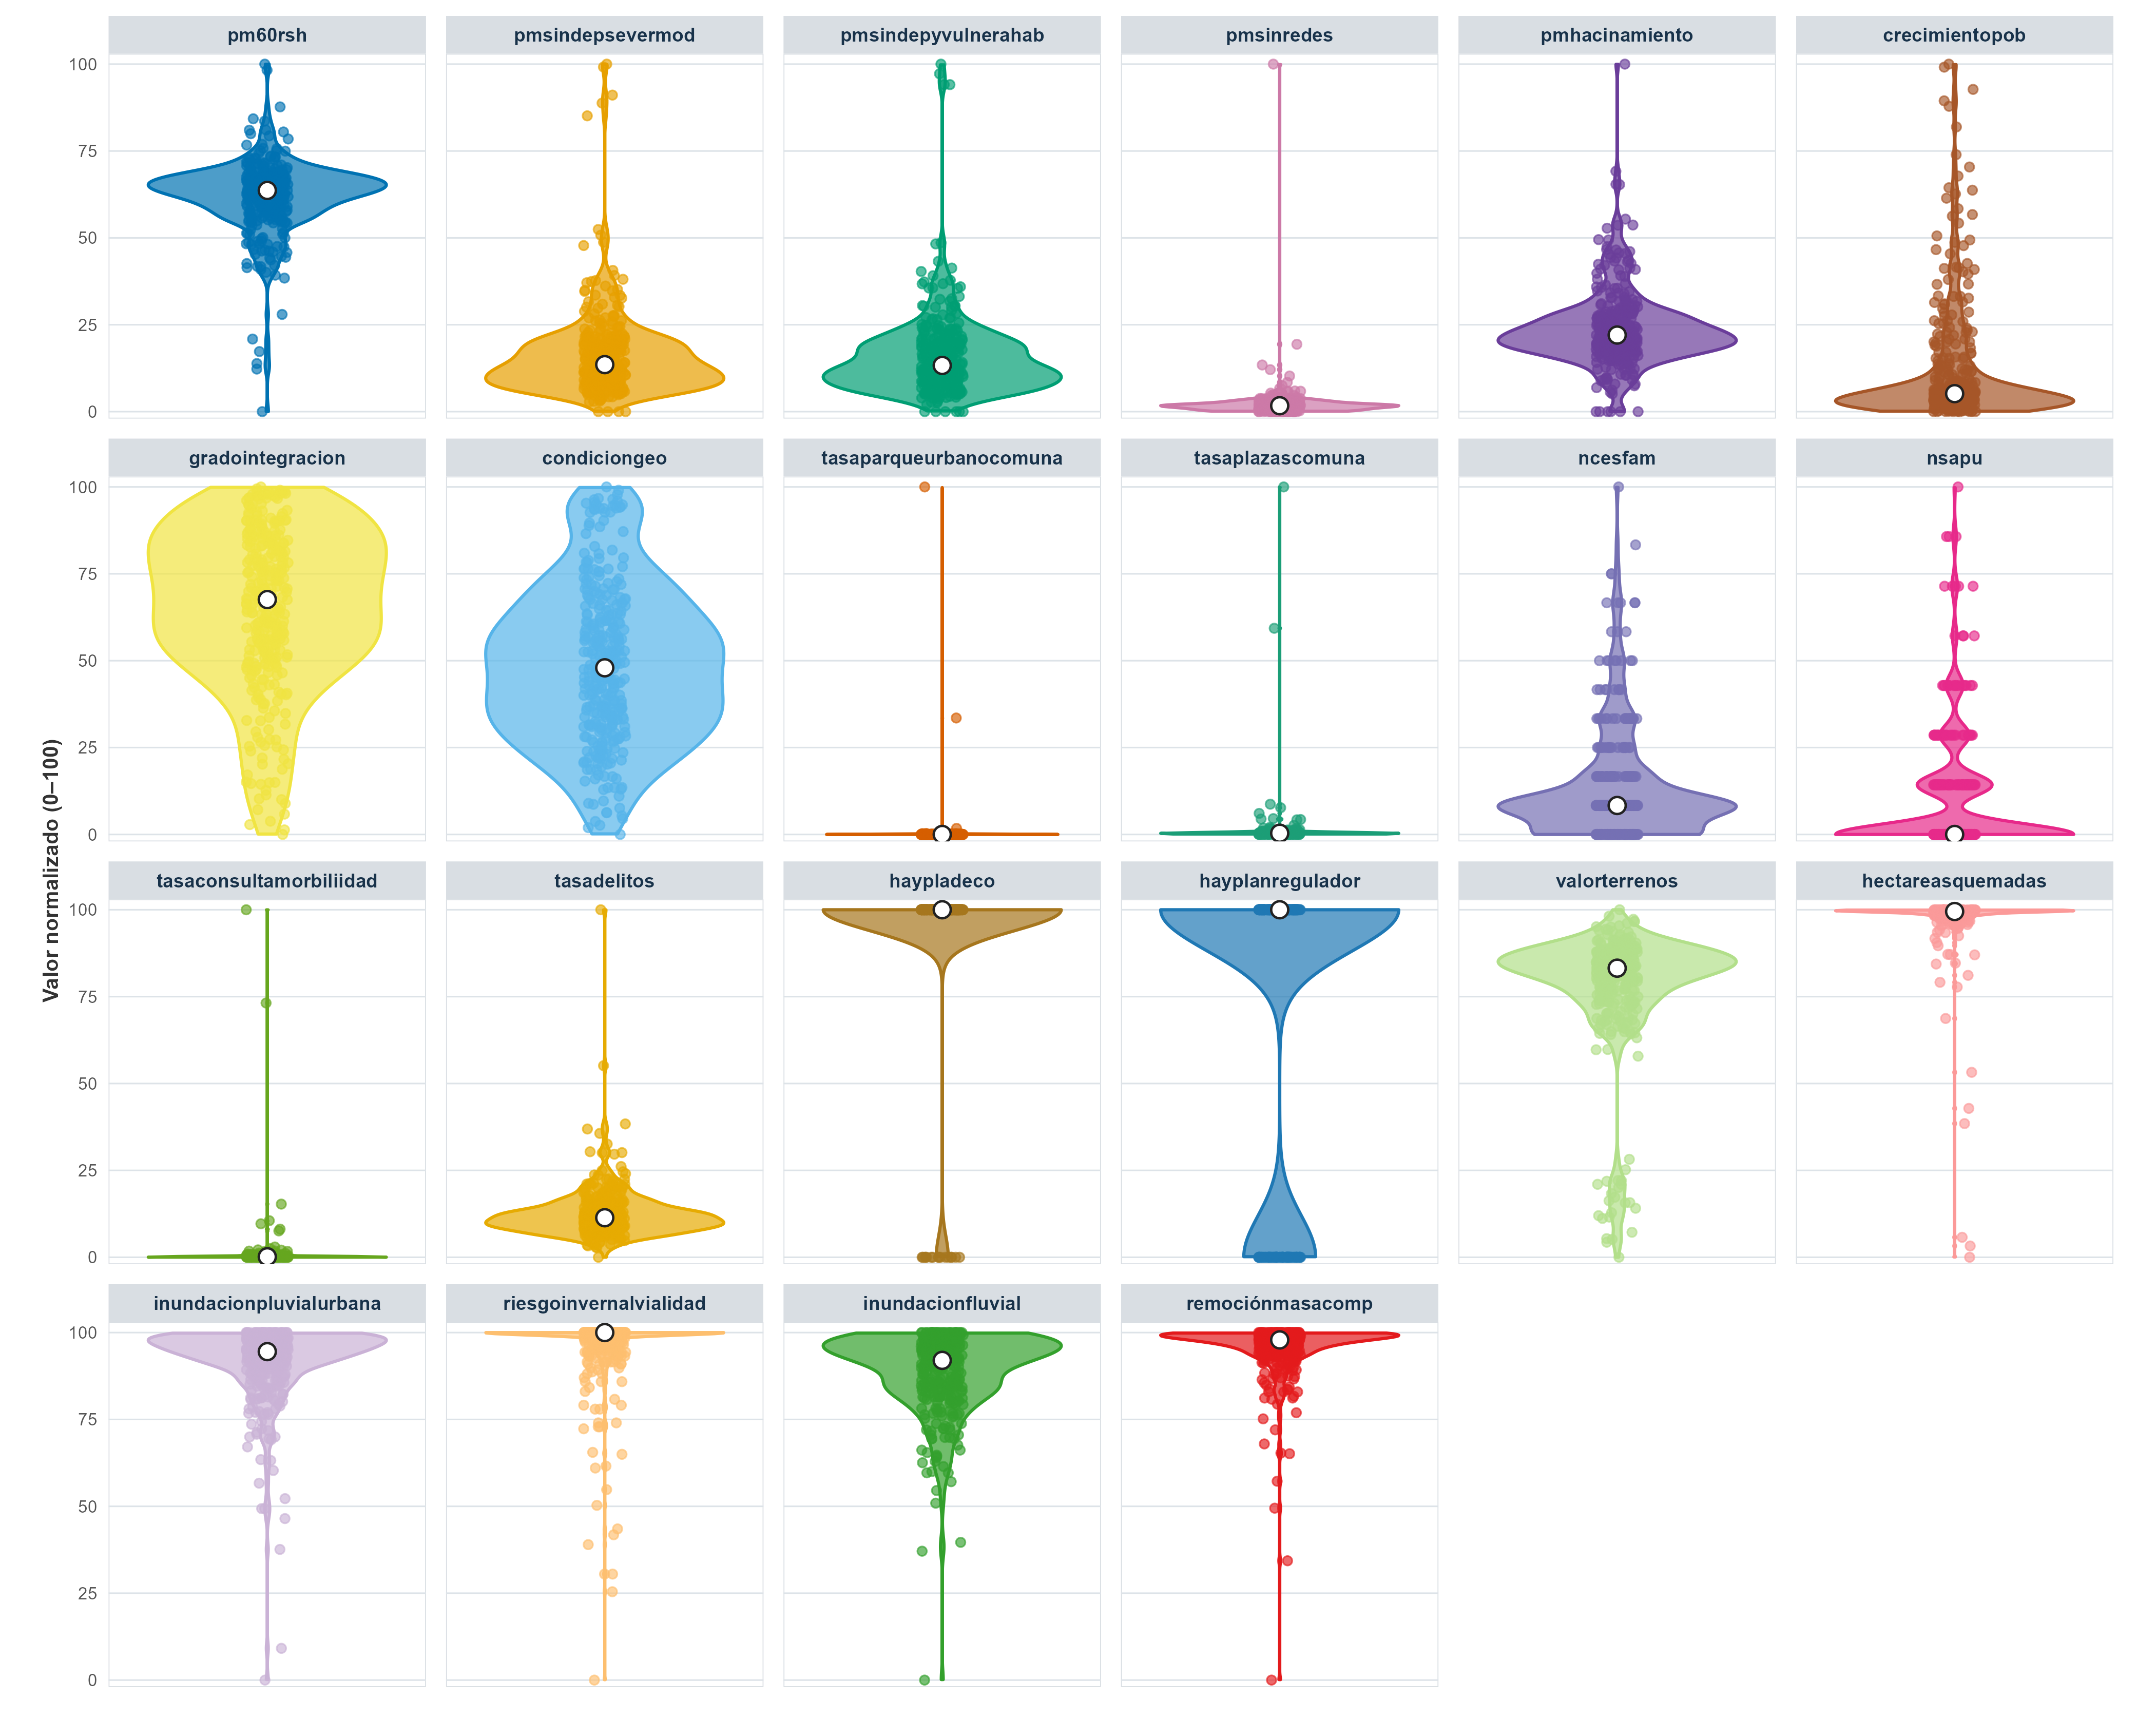
The distribution of the normalized indicators provides an overview of the variation and concentration of territorial conditions across the 52 communes of the Metropolitan Region.
All indicators have been transformed to a common scale ranging from 0 to 100, allowing their relative territorial distributions to be examined using a consistent metric. The violin plots show the density of observations, while the individual points represent the normalized values observed across communes. The white points indicate the median value of each indicator.
Sensitivity analysis
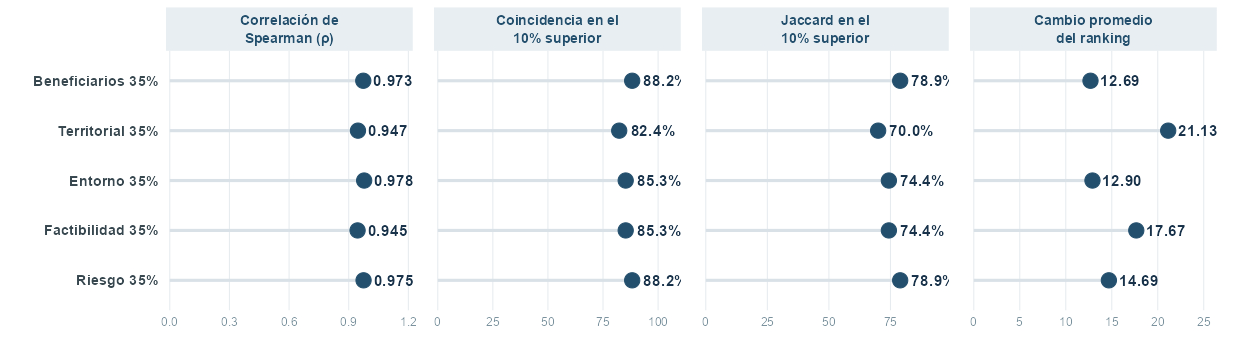
The robustness of the IPT-CVT was assessed by examining how changes in the weighting of the main dimensions affect the resulting territorial prioritization.
The analysis compares the alternative scenarios using rank correlation, the coincidence among the 10% highest-priority communes, the Jaccard index for the top 10%, and the average change in commune rankings.
The results provide an assessment of the stability of the territorial prioritization under alternative weighting specifications.
Explore the IPT-CVT
The IPT-CVT can be examined from different analytical perspectives. Select an option below to explore the results.
Distribution of normalized indicators